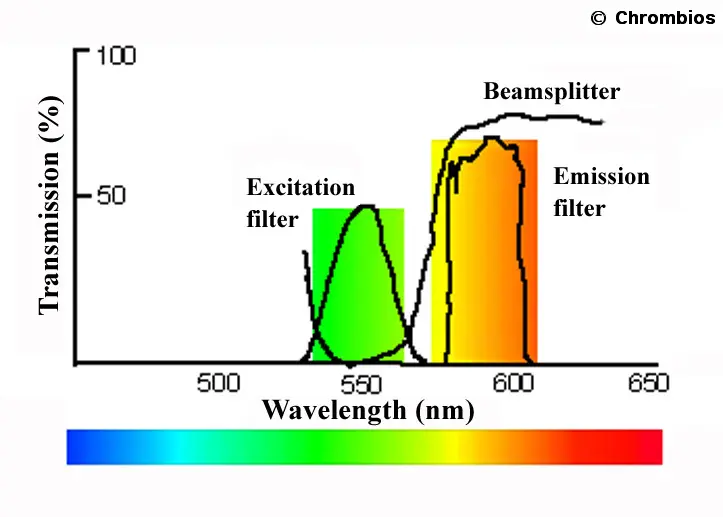
Illustration of the characteristics of a simple filter set consisting of band pass excitation and emission filters and a long pass beam splitter. The excitation filter has a bandwidth of about 30nm with a peak closely to 550nm. The emission filter has a similar bandwidth with a peak at about 590nm. The beam splitter acts like a mirror beyond about 570nm and directs the light on to the specimen. The fluorescent light emitted from the specimen, however, can pass the beam splitter.
In the simplest configuration, for each fluorescent dye a single filter set is used. To allow the inspection of different fluorochromes these filters can be manually changed in a slider or, in a more advanced setup, moved in a motorized filter wheel. In case the hybridization signal should be analyzed directly in the microscope by eye the signal should be visible together with the counter stain. Thus, a filter should be used that fits both stains. For example, a simple filter set with a broad emission for both green and orange fluorescence will allow the visualization of both the FITC hybridization signal and the counter staining with propidium iodide. In this example the green hybridization signal will appear yellow on a red background staining of chromosomes. More complicated are multi band pass filters especially designed for specific fluorochrome combinations such as DAPI/FITC/Cy3™ or DAPI/FITC/ TexasRed™. Documentation of these fluorescent signals would need classical color photography, a color TV or a CCD camera.
Basic multi color setup
More advanced FISH systems make use of a black/white charge-coupled device (CCD) camera mounted to the microscope and connected to a computer that records each individual fluorescence signal as a black/white image and converts it to false colors. In case of a combination of the fluorochromes DAPI/FITC/Cy3™ /Cy5™, each fluorescence signal will be recorded by an individual filter as shown in Figure 12. These images are then merged at the computer (Figure 13). The advantage of this setup is that each image plain can be manipulated separately by image processing software. Thus, for a better chromosome identification, the DAPI counter stain can be enhanced by certain electronic filters to display a banding pattern which is close to the quality of classical G-banding. Further, hybridization signals of low intensity can be enhanced or too strong signals balanced. Most importantly, however, this setup is essential for increasing automation of fluorescence microscopy.
Figure 13: Multi color FISH experiment using four different fluorochromes (DAPI, FITC, Cy3™ and Cy5™). DAPI is used as a counter stain to visualize the metaphase chromosomes. The other fluorochromes are used as labels for painting chromosomes 5, 8 and 15, respectively. Each fluorescent image is recorded by a black/white CCD camera through narrow band pass filters and displayed by the computer in false colors in green (chromosome 8), red (chromosome 15) and blue (chromosome 5). The individual images for the chromosome painting are shown in d) to f). a) to c) display the images merged by image processing: a) all four image plains merged, the DAPI fluorescence is displayed in gray. b) the same as a), the counter stain of the DAPI, however, is inverted to show chromosome banding. c) merged image of the three hybridization signals.